 |
| OwenDuffy.net |
|
VK1OD is located in a low density residential area in the suburbs of Canberra, Australia's national capital. Canberra is a city of about 300,000 population, an administrative centre, and does not have heavy industry, but commercial and light industrial areas exist.
Major cities exist to the north-east (Sydney), and to the south-west (Melbourne). Though Sydney is closer, rising granite in that direction is an obstacle. This article explores the path to Melbourne which has good prospects of aircraft enhanced propagation because of the population in Melbourne and surrounds, and the flight path from Sydney to Melbourne being roughly overhead.
 |
Melbourne is 470km distant at a bearing of 231°, just through the middle of the skyline in Fig 1. The elevation of the horizon in the direction of Melbourne is 1.25° at 42km (Mt Franklin).
Black Mountain tower (television transmitter site, analogue and digital) can be seen just to the right of centre, it is 12° off bore sight, so well within the main lobe, and 5km distant. Not visible in the picture and within the main lobe is the CBD of Civic, the old centre of Canberra just 3km distant.
Table 1 sets out the configuration that forms the base for analysis of itself and alternate scenarios.
| Item | Element | Value | Comments |
| 1 | TS2000 | NF=7.9dB | 300/2400 filter Measured sensitivity=-124.5dBm for 10dB SINAD, ENB=1450Hz Receiver sensitivity metric converter |
| 2 | 1m RG213 patch cable | 0.084dB loss | Calculated RF Transmission Line Loss Calculator |
| 3 | 10m RG213 | 0.84dB loss | Calculated RF Transmission Line Loss Calculator |
| 4 | Hy-gain VB214 14el Yagi, | 15.2dBi gain from spec
VSWR 1.17 |
Measured 100W fwd, 0.4W reflected at
tx VSWR calculator. E-plane half power beamwidth should be about 32°. |
ITU-R P.372-8 gives some indication of expected radio noise levels Table 2 shows the expected ambient noise at 144MHz.
| Business (curve A) (dB) |
Residential (curve
B) (dB) |
Rural (curve C) (dB) |
Quiet rural (curve
D) (dB) |
Galactic noise
(curve E) (dB) |
|
| Fa (dB) | 17.0 | 12.7 | 7.4 | -8.1 | 2.4 |
| Ta (K) | 14579 | 5417 | 1599 | 45 | 499 |
The ambient noise was measured using the techniques and tools described at Ambient noise calculator. The internal attenuator in the TS2000 was measured at 12dB, and measurements made over a period of time of the ambient noise. The results are show in Table 3.
| Ambient noise calculator - results
144MHz, TS2000, VB214 pointing 231° 10 September 2006 16:09:09
|
||||||||||||||||||||||||||||||||||||
The best ambient noise figure was 8.9dB, though it was up to 10db higher for extended periods. These levels fall in the Rural to Residential categories in ITU-R P.372-8, with highest levels exceeding the Business category.
This analysis focuses on a single figure of merit for the entire receive system, and that is the G/T ratio (the ratio of antenna gain to system equivalent noise temperature. G, Antenna gain is with reference to the antenna connector. T, system noise temperature, is the total system noise, including sky temperature (or ambient noise) referred to the antenna connector.
The G/T ratio is a meaningful indicator of system performance, unlike quoting receiver noise temperature in isolation of sky temperature and antenna gain. The ability to receive weak signals is directly related to G/T, the higher G/T, the better. Signal/Noise ratio is proportional to G/T (Signal/Noise=S * λ2/(4*π) * G/T / (K*B) where S is power flux density, K is Boltzman's constant, and B is receiver effective noise bandwidth).
So, if changing the receiver Noise Figure from 5dB to 1db improves the G/T ratio by just 0.1dB/K, the real benefit of the change is just 0.1dB.
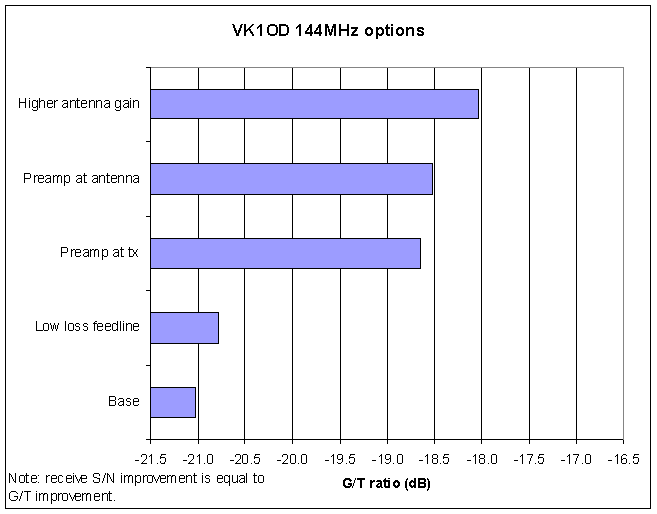
The G/T ratio for a base scenario and four improved scenarios was calculated using the techniques and tools described at Effective use of a Low Noise Amplifier on VHF/UHF, the results are set out in Table 4 and Figure 2.
| Scenario | Description | G/T (dB/K) |
| Base | TS2000 transceiver (E-type), 10m RG213 feedline, Hy-gain 15.2dBi VB214 yagi | -21.0 |
| Low loss feedline | replace 10m of feedline with LDF4-50 | -20.8 |
| Preamp at tx | 20dB gain, 0.8dBNF preamp at transceiver | -18.6 |
| Preamp at antenna | 20dB gain, 0.8dBNF preamp at antenna | -18.5 |
| Higher antenna gain | stacked antenna with additional 3dB gain | -18.0 |
 |
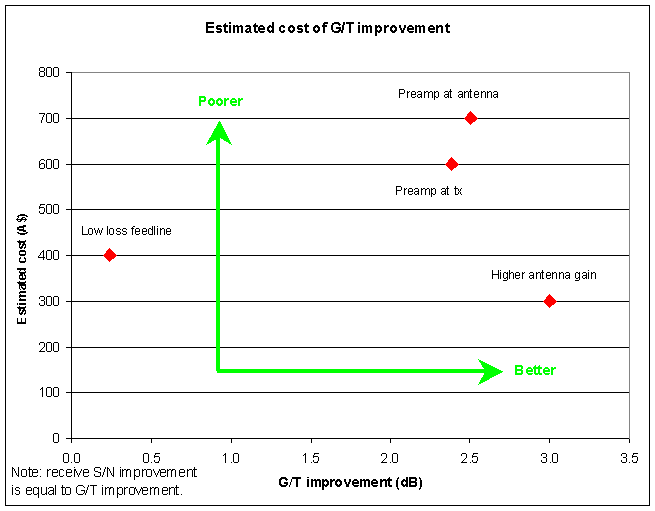
Fig 3 shows the cost effectiveness of improvement in the four improved scenarios. Costs of both preamp options could be significantly higher in a high power station which may require coax relays and sequencer.
 |
The outcomes here are specific to the configuration and the environment.
Transmit performance is expressed in the Equivalent Isotropically Radiated Power (EIRP).
EIRP was calculated using the VSWR calculator and is summarised in Table 5.
| Scenario | Description | EIRP (W) | EIRP (dBW) |
| Base | TS2000 transceiver (K-type), 10m RG213 feedline, Hy-gain 15.2dBi VB214 yagi | 2675 | 34.3 |
| Low loss feedline | replace 10m of feedline with LDF4-50 | 2977 | 34.7 |
| Preamp at tx | 20dB gain, 0.8dBNF preamp at transceiver | 2675 | 34.3 |
| Preamp at antenna | 20dB gain, 0.8dBNF preamp at antenna | 2675 | 34.3 |
| Higher antenna gain | stacked antenna with additional 3dB gain | 5338 | 37.3 |
Only one improved scenario significantly improves the transmit performance, it is the "Higher gain antenna" option.
| Scenario | Description | G/T (dB/K) | EIRP (dBW) |
| Base | TS2000 transceiver (K-type), 10m RG213 feedline, Hy-gain 15.2dBi VB214 yagi | -21.0 | 34.3 |
| Low loss feedline | replace 10m of feedline with LDF4-50 | -20.8 | 34.7 |
| Preamp at tx | 20dB gain, 0.8dBNF preamp at transceiver | -18.6 | 34.3 |
| Preamp at antenna | 20dB gain, 0.8dBNF preamp at antenna | -18.5 | 34.3 |
| Higher antenna gain | stacked antenna with additional 3dB gain | -18.0 | 37.3 |
The "Higher gain antenna" option is the only scenario that provides significant improvement of both transmit and receive performance, and it does it not only more cost effectively, but at lower cost.
This analysis is only valid for the scenarios modelled, and the situation will vary from station to station. Other factors may be relevant or even important in different situations.
The article shows a method for approaching the problem analytically and objectively, discounting low value options, and understanding the value proposition of the higher value options.
| Version | Date | Description |
| 1.01 | 10/09/2006 | Initial. |
| 1.02 | ||
| 1.03 | ||
| 1.04 | ||
| 1.05 |
© Copyright: Owen Duffy 1995, 2021. All rights reserved. Disclaimer.