Accuracy of narrowband audio noise measurements with a digital multimeter
| This article reports an experiment to measure narrow band noise using two different digital multimeters with automated data logging. |
Overview
Narrowband noise from an SSB telephony receiver was measured using two different modern digital multimeters:
- 9932 - NOT a true RMS responding meter;
- 506 - true RMS responding.
The measured equivalent noise bandwidth of the receiver output is 1600Hz, and the output is approximately 200mV RMS. Both instruments are used on a 2V range, with the least significant display digit having weight of 1mV.
Observation with a stopwatch indicates that the 9932 updates the display about 3 times per second, so it is assumed that its measurement integration time is 0.33s. The 506 updates the display about 2 times per second, so it is assumed that its measurement integration time is 0.50s.
Measurements
9932
Specifications
The 9932 accuracy on the range is use is specified at ±0.8% of reading ±3 digits.
Sine wave measurement
The 9932 was used to make 250 measurements of a sine wave oscillator at about 200mV RMS. By careful adjustment of the oscillator level, it was possible to get entire measurement sets with no change, and equally to up to an equal number of two adjacent values. The worst case measurement error occurs when there are an equal number of two adjacent value, and the standard error is 0.5mV or 0.0025% at 1σ. This behaviour was identical at nearby input voltages, but no attempt was made to quantify the linearity or absolute error.
Noise measurement
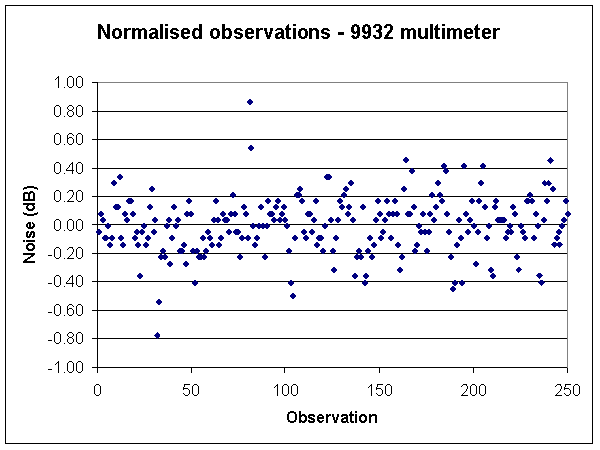
The 9932 was used to make 250 measurements of receiver audio noise output at about 200mV RMS.
 |
Fig 1 shows the scatter of the measurements. Ninety five percent (95%) of observations fell within ±0.41dB.
Measurements
506
Specifications
The 506 accuracy on the range is use is specified at ±1.5% of reading +5 digits.
Sine wave measurement
The 506 was used to make 250 measurements of a sine wave oscillator at about 200mV RMS. By careful adjustment of the oscillator level, it was possible to get entire measurement sets with no change, and equally to up to an equal number of two adjacent values. The worst case measurement error occurs when there are an equal number of two adjacent value, and the standard error is 0.5mV or 0.0025% at 1σ. This behaviour was identical at nearby input voltages, but no attempt was made to quantify the linearity or absolute error.
Noise measurement
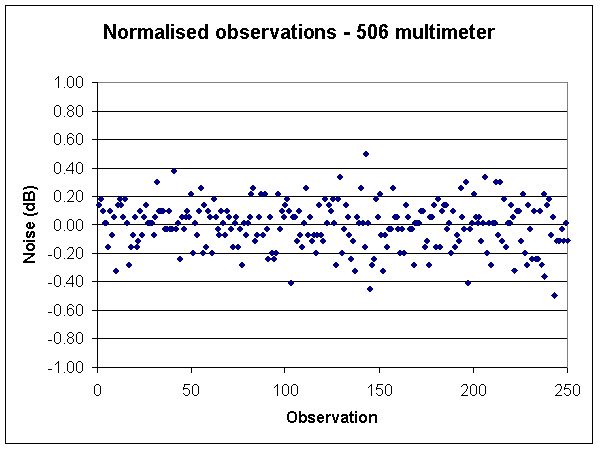
The 506 was used to make 250 measurements of receiver audio noise output at about 200mV RMS.
 |
Fig 1 shows the scatter of the measurements. Ninety five percent (95%) of observations fell within ±0.31dB.
Analysis
 |
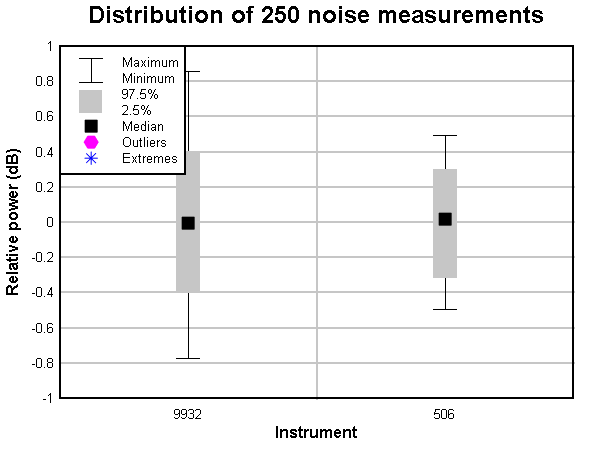
Fig 3 compares the distribution of measurements using the two meters.
Both instruments have two components of specified error. One related to the percentage of the reading which is less relevant to relative measurements as those above, and representational error expresses in digits.
The observed worst case error on relative sine wave measurements at about 200mV with both instruments was ±1 count. This observed error is used in the table below.
Estimated standard uncertainty due to noise sampling (mV) is estimated using the Noise measurement uncertainty calculator in dB and converted to mV uncertainty for a 200mV RMS noise waveform.
| Meter | Estimated integration time (s) | Estimated standard uncertainty due to noise sampling (mV) | Standard instrument uncertainty (dB) | Expanded combined uncertainty at 95% confidence (mV) | Expanded combined limit of 95% of measurements (dB) | Observed limit of 95% of measurements (dB) |
| 9932 | 0.33 | 4.56 | 0.58 | 9.02 | 0.40 | 0.41 |
| 506 | 0.50 | 3.71 | 0.58 | 7.36 | 0.33 | 0.31 |
Table 1 shows a comparison of expected and observed uncertainty. Instrument uncertainty does not account for the full variation in actual measurements, but experimental results are very similar to uncertainty estimated from a model that includes the estimated standard uncertainty due to noise sampling.
Conclusions
The model and the experimental results both suggest that these and similar multimeter are not capable of single high resolution relative measurements of narrowband audio noise such as measuring S/N ratios or Y factor for noise figure measurement due mainly to the short integration time in combination with narrow bandwidth.
It may be possible to improve resolution by taking multiple measurements and calculating the root of the mean of the squares of the measurements, but errors in the summary process and in temporal drift become an issue.
Links
Glossary
| Term | Meaning |
| dB | decibel - power ratio |
Changes
| Version | Date | Description |
| 1.01 | 28/05/2007 | Initial. |
| 1.02 | ||
| 1.03 |
V1.01 17/02/09 14:27:01 -0700 .
Use at your own risk, not warranted for any purpose. Do not depend on any results without independent verification.