| OwenDuffy.net |
|
The experiment was to explore the use of audio spectrum analysis of a receiver output to measure end to end intermodulation distortion (IMD) of a transmitter / receiver system.
A two tone test signal was synthesised digitally to create a wave file. The choice of tones is influenced by the need for the tones and third and fifth order products to pass within the flat section of the passband of a typical SSB receiver. The centre of the passband is typically around 1500Hz, and bandwidth of the flat section typically about 1200Hz. The tones are chosen at 1400Hz and 1600Hz which will cause fifth order products at 1000Hz and 2000Hz.
The two tones were synthesised as a mono wave file at -6.5dB with 44.1kHz sampling and 16bit coding. The two files were mixed to produce a two tone test signal of -1dB to avoid clipping.
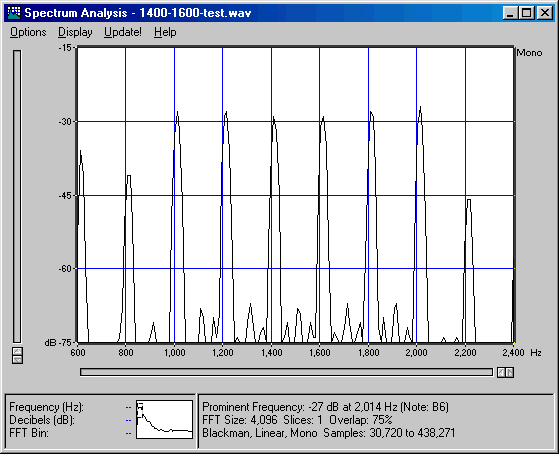
For calibration purposes, another wave file with equal amplitude tones (-16dB) at 1000,1200,1400,1600,1800 and 2000 Hz was created. This test signal can be used to check that the system passband is sufficiently flat for measuring the third and fifth order products.
The transmitter (Kenwood TS-2000) was connected to a dummy load and the twotone wave file was played into the auxiliary audio input and adjusted for full power output (in fact sufficient drive to slightly exceed the recommended ALC operating range).
The receiver (Kenwood R-5000) was fitted with a small whip antenna and front end attenuation adjusted for half scale (S9) deflection on the S meter.
The audio record output was connected to the sound card and recorded to a wave file (44.1kHz sampling and 16bit coding). The wave file was analysed using the spectrum analysis function of Sound Forge (although any audio spectrum analysis software would work) and the level of the IMD products measure wrt PEP (which is 6dB higher that the two test tones.
The figure below shows the system passband to be sufficiently flat to make direct measurements (ie without correction).
 |
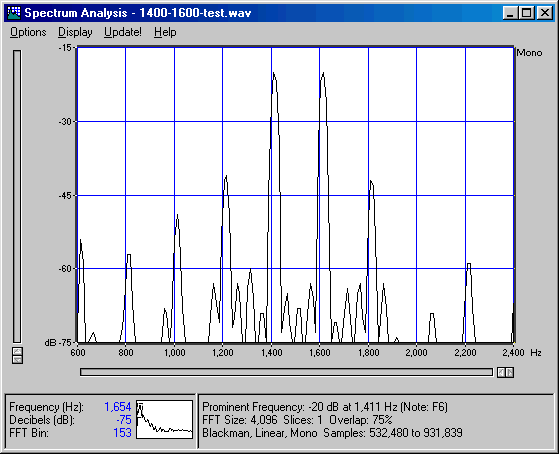
In the figure below, the two tones are at -20B, so the PEP is -14dB and the low third order product shown is (-41dB)-(-20dB)=-21dBc, or (-14dB) - (-41dB), or 27dB down on PEP, the high one is a little over 1dB better (ie -22dBc or PEP-28dB). The measurement is end to end using a communications receiver with a SSB filter as part of the instrumentation, so it accuracy is limited a little. However, the measurement results indicate that this transmitter is at the low end of acceptable IMD performance.
 |
© Copyright: Owen Duffy 1995, 2021. All rights reserved. Disclaimer.